

Advanced Battery Tips from Floor Equipment Experts
- Home
- Safety Guidelines
- Working with Batteries
- Advanced Battery Tips
Wet Battery Testing
Visual inspection alone is not sufficient enough to determine the overall health of a battery
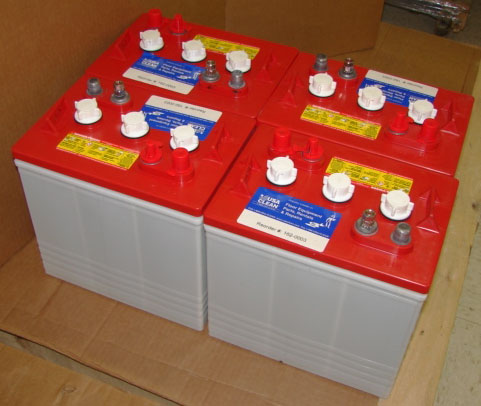
Open-circuit voltage and specific gravity readings can give a good indication of a battery’s charge level, age, and health. Routine checks will also help to reveal signs of improper care, such as undercharging and over-watering, and possibly even locate a bad or weak battery.

Open-Circuit Voltage Test
For accurate voltage readings, fully charge the batteries and do not charge or discharge the batteries for at least 6 hours but preferably 24 hours prior to testing.
- Disconnect all loads from the batteries
- Use a voltmeter to measure the voltage
- Check the state of charge with the table below
If the battery registers below the given table values, then the battery should be replaced.
State of Charge (SOC) (%) – An expression of the present battery capacity as a percentage of maximum capacity. SOC is generally calculated using current integration to determine the change in battery capacity over time.
Depth of Discharge (DOD) (%) – The percentage of battery capacity that has been discharged expressed as a percentage of maximum capacity. A discharge to at least 80% DOD is referred to as a deep discharge.
| State of Charge (SOC) | 6 Volt | 12 Volt | Volts per Cell | 24 Volt | 36 Volt | Depth of Discharge (DOD) |
|---|---|---|---|---|---|---|
| 100% | 6.36V | 12.70V | 2.12V | 25.40V | 38.10V | 0% |
| 90% | 6.24V | 12.50V | 2.08V | 25.00V | 37.50V | 10% |
| 80% | 6.21V | 12.42V | 2.07V | 24.85V | 37.25V | 20% |
| 70% | 6.15V | 12.32V | 2.05V | 24.65V | 37.00V | 30% |
| 60% | 6.10V | 12.20V | 2.03V | 24.40V | 37.50V | 40% |
| 50% | 6.03V | 12.06V | 2.01V | 24.10V | 37.50V | 50% |
| 40% | 5.95V | 11.90V | 1.98V | 23.80V | 37.50V | 60% |
| 30% | 5.88V | 11.75V | 1.96V | 23.50V | 37.50V | 70% |
| 20% | 5.79V | 11.58V | 1.93V | 23.20V | 37.50V | 80% |
| 10% | 5.67V | 11.31V | 1.89V | 22.60V | 37.50V | 90% |
| 0% | 5.25V | 10.50V | 1.75V | 21.00V | 37.50V | 100% |
- Healthy wet cell batteries will reach a maximum on-charge voltage of 2.5 to 2.6 volts per cell. Resting voltage of 2.12 per cell.
- Wet cell batteries should never be discharged below 1.75 volts per cell in normal operations.
Load Test
Load test shows how the baseline voltage reacts to demand. This can be tested in the following ways:
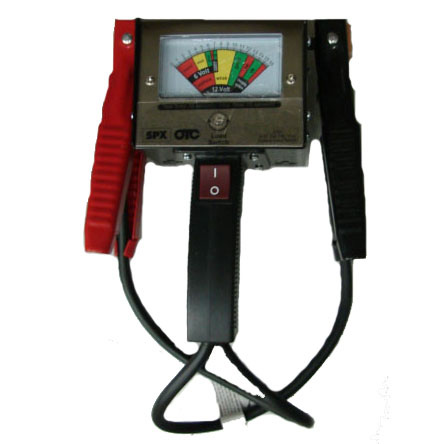
Hand Held Load Tester
- This portable device puts on a high amp load for 10 seconds
- Load testers are designed to test starter batteries for a short duration and do no apply a load long enough to conclusively determine if a deep cycle battery is completely functional
- The readout shows if the batteries Pass or Fail based on the voltage drop
- If the battery fails then it needs to be replaced. If it is passes, the battery is not necessarily healthy and further evaluation is required if the end user is experiencing low runtime
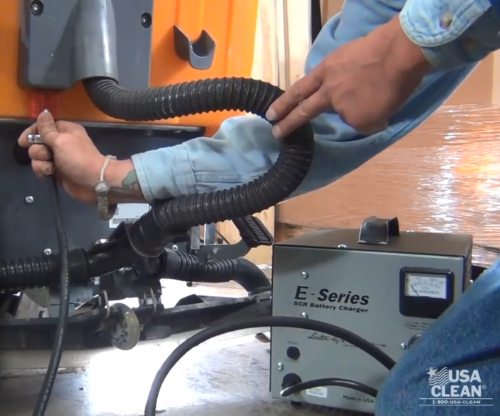
Component Loading
- This method uses the machine components to drain the battery pack over several minutes
- For example, run the vacuum motor and monitor battery voltage
- 15 minutes or more may be needed
- Does the voltage drop make sense? Is each battery consistent?
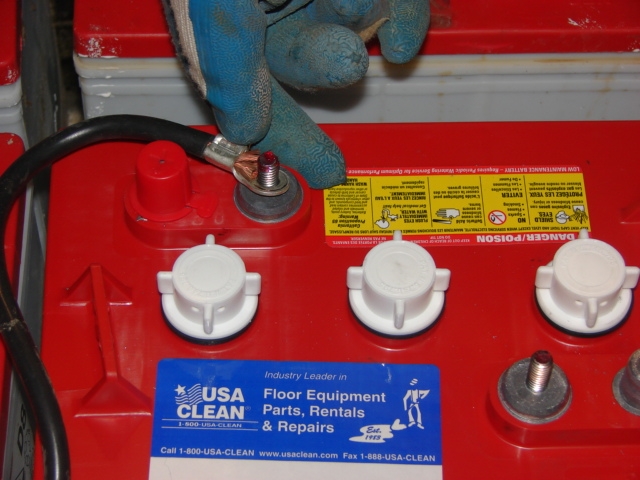
Specific Gravity Test
- Do not add water at this time
- Fill and drain the hydrometer 2 to 4 times before pulling out a sample
- There should be enough sample electrolyte in the hydrometer to completely support the float
- Take a reading, record it, and return the electrolyte to the cell
- Repeat the steps 2-4 to test the other battery cells
- Replace the vent caps and wipe off any electrolyte that might have spilled
- Correct the readings to 80°F:
- Add .0004 to readings for every 10°F above 80°F
- Subtract .0004 for every 10°F below 80°F
- Compare the readings
- Check the state of charge by using the below table
Using a Hydrometer
Remember these tips when using a hydrometer:
- Hydrometer reading of all cells should be at least 1.225 and show less than .05 points difference between high and low
- Hydrometers using a float with a graduated scale are best. Avoid types with floating colored balls or inaccurate dials.
- Hydrometer readings should not vary more than .05 between cells. If you see a larger difference, this could indicate a bad cell.
| State of Charge Level | Specific Gravity |
|---|---|
| 100% | 1.265 or Greater |
| 75% | 1.225 - 1.230 |
| 50% | 1.185 - 1.190 |
| 25% | 1.140 - 1.175 |
| Discharged | 1.125 or Less |
Resolution Steps
- More than .05 points difference: replace the battery
- Less than .05 points, but some cells read less than 1.225: recharge the battery
- Replace the vent caps during recharge
- Charge the battery using a properly matched automatic charger until all cells measure a specific gravity of 1.265 to 1.275
- If charging won’t bring up specific gravity, replace the battery
The .84 Method
- This allows you to verify battery voltage without a voltmeter
- Take the specific gravity per cell, add .84 to the number and you should end up with the same as the voltage reading
| Example: | 1.200 | specific gravity |
|---|---|---|
| + .840 | method | |
| 2.040 | voltage for that cell |
Low Voltage Shutdown
- Approximately 25.40V is a full charge for 24V systems and 38.10V for 36V systems
- Some battery models are equipped with low voltage shutdown
- Battery scrubbers go into low voltage shutdown mode when they reach the following approximate voltages* (for TASKI models, check the battery type setting using TASKI service software)
- 23.5V for AGM batteries
- 20 to 22V for Wet batteries
- These are approximate voltages. Please check with manufacturers for specific voltages.
- Transportation mode is activated until the machine can reach its location to be charged
- Batteries need to be fully charged and fully cycled each use
AGM Battery Testing
AGM testing is different than wet testing because specific gravity cannot be tested.
- Make sure the batteries are fully charged*
- Obtain the voltage readings from each battery
- Load test the batteries and record the results
- If applicable, disconnect the onboard charger
- Attach a volt meter and run the machine for 20 minutes under a full load**
- After 20 minutes, document the voltage while under load
- Continue to operate the equipment for an additional 5 minutes while watching the voltage
-
- * The battery industry's standard level for AGM batteries is a maximum on-charge voltage measurement of 2.38 volts per cell (28.56V for a 24V system). Refer to Open-Circuit Voltage Test for further state of charge details.
- ** Test procedures require a 20 minute runtime because the typical battery load tester does not apply a load long enough to notice quality errors in the manufacturing of new AGM batteries.
- Suspect batteries will often give a normal voltage reading while at rest. However, the voltage will decline rapidly or will be erratic while under load. This may take 15-30 minutes before the symptoms are exhibited. AGM batteries that are failing can give the impression of good performance for an extended period of time before exhibiting a rapid voltage decline while under load.
- The resting voltage (no load) will immediately rebound so testing the battery without a load will yield “healthy” results making it appear that batteries are fine. Once a load is reapplied and the battery pack voltage is monitored, the voltage will quickly fall and yield the packs actual voltage capacity.
- Healthy batteries will decline in a linear, predictable rate.
Battery Factoids
- Nearly all batteries will not reach full capacity until cycled 10-30 times. A brand new battery will have a capacity of about 5-10% less than the rated capacity.
- Lead-Acid batteries DO NOT have a memory, and the rumor that they should be fully discharged to avoid this “memory” is totally false and will lead to early battery failure.
- At around 10.5 volts, the specific gravity of the acid in the battery gets so low that there is very little left that it can do.
- Batteries in storage should be above 2.07 volts per cell. They will begin the process of internal sulfation at 2.07 volts. Batteries that drop below 2.0 volts per cell while in storage will suffer significant and irreversible damage.
- False Capacity - a battery can meet the voltage tests for being at full charge, yet be much lower than its original capacity. If plates are damaged, sulfated or partially gone from long use, the battery may give the appearance of being fully charged, but in reality acts like a battery of a much smaller size. This same thing can occur in AGM cells if they are overcharged and gaps or bubbles occur. What is left of the plates may be fully functional, but with only 20% of the plates left. Batteries usually go bad for other reasons before reaching this point, but it is something to be aware of if your batteries seem to test okay but lack capacity and go dead very quickly under load.
- Voltage readings will NOT tell you how good the battery condition is - only a sustained load test can do that.
- Battery life is directly related to how deep the battery is cycled each time. Most golf cart batteries are rated for about 550 cycles at 80% depth of discharge.
| Example: | 24V = 21.00V at 100% DOD | 24V = 23.20V at 80% DOD |
| 36V = 31.50V at 100% DOD | 36V = 34.75V at 80% DOD |
- Water should be added after fully charging the battery pack unless the water is too low and the plates are exposed.
- Plate thickness (of the positive plate) matters because of a factor called “positive grid corrosion”. This ranks among the top 3 reasons for battery failure. The positive (+) plate is what gets eaten away gradually over time, so eventually there is nothing left. It all falls to the bottom as sediment. Thicker plates are directly related to longer life, so other things being equal, the battery with the thickest plates will last the longest. The negative plate in the batteries expands somewhat during discharge, which is why nearly all batteries have separators, such as a glass mat or paper, which can be compressed.
- Wet batteries discharge 5-10% a month while AGM batteries discharge 2-3% a month.
- Older batteries self-discharge faster than new batteries. Older wet batteries may discharge as much as 7% a week. Older AGM may discharge 2% a week.
- Automotive batteries typically have plate about .040” thick, while forklift batteries may have plates more than .025” thick. This is almost 7 times as thick as auto batteries. The typical golf cart will have plates that are around .07 to .11” thick. US Battery and Trojan L-16 types are .090”. The Crown L-16HC size has .22” thick plates.

Sulfation
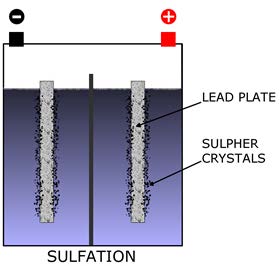
During use, small sulfate crystals form, but these are normal and not harmful to the batteries. During prolonged charge deprivation, the amorphous lead sulfate converts to a stable crystalline that deposit on the negative plates. This leads to the development of large crystals which reduce the battery’s active material and negatively impact capacity.
Battery Manufacturer Date Codes

Crown Battery
Two ways to identify the age of the battery:
- Date sticker on top of the battery. The letter on the code stands for the month. The second and third number represent the year.
Example: A17 = January 2017
Example: L15 = December 2015 - The battery has a plate number on the front of the battery that is engraved with the MFG date, shift, year, etc.
| Month | Year |
|---|---|
|
|

Deka Battery
The letter on the code stands for the month and the number stands for the year. “I” is skipped in the months to eliminate confusion with the number “1”.
Example: L2 = November 2012
| Month | Year |
|---|---|
|
|

FullRiver Battery
 For the example, reference the accompanying date code photo.
- “K” (1st Character) means year 2000.
- “14” (2nd & 3rd Character) means the specific year made. In this example, the battery was made in the year 2014.
- “04” The 4th and 5th character represent the week number of that year. In this example, the battery was made in the fourth week of 2014, or the last week of January.
- If there are any other additional characters (in this example, the “02”), then these are strictly factory and operator codes.

Interstate Battery
There is a 4 to 5-digit code engraved into the cover. The first 2 digits on the far left will tell you the month and date of the battery.
Example: B2 = February 2012
| Month | Year |
|---|---|
|
|

Trojan Battery
The letter on the code stands for the month and the number stands for the year.
Example: B5 = February 2015
Example: C4 = March 2014
| Month | Year |
|---|---|
|
|

U.S. Battery
For flooded lead acid batteries the date code is stamped and the first letter refers to the month, the number refers to the year and the last letter refers to the manufacturer location.
Example: K4X = November 2014 Corona
For AGM the date is etched into the case of the battery. The date is written in a DDMMYY format.
Example: 150914 = September 15, 2014
| Month | Year | MFG Location |
|---|---|---|
|
|
|